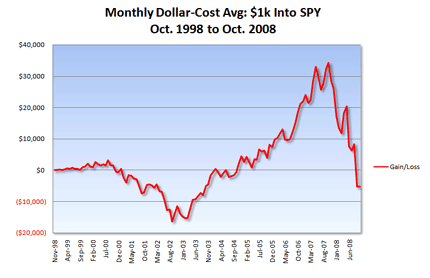
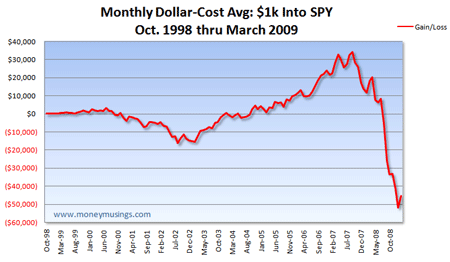
Back then, the chart looked like so:

Here we are, roughly five months later. Investors clamoring for solace are now even more empty-handed. Or empty-walleted, as the case may be.

Our hero, Diligent Investor, has now been pumping cash into his brokerage account for 126 months. On an out-of-pocket basis, he's invested $126k.
As of the end of March, his investment is now worth $93,252. That's a loss of $32,747. Percentage-wise, he's down 26 percent.
Now, if you're like me (and the IRS) and are interested in the real costs of this investment, you'll count all reinvested dividends as part of your cost basis (as the chart above does).
In that instance, Mr. Investor's cost basis is actually $138,563. Remember: He could've taken those dividends and spent them on hookers and blow, but instead he chose to reinvest them in the S&P 500 fund. They are, therefore, part of his cost.
His loss is now an artery-bursting $45,310. On a percentage basis, his account has shed almost 33 percent of its value. (It was even worse at the end of February, mind you. Then he was down $51,750.)
In just seventeen months, he's gone from a $34k gain (in October of 2007) to a $45k loss. And that's with March's impressive market run-up. (In the face of yucky news, I might add.)
Please note that I've not included transaction costs in the above examples. If Mr. Investor has free lifetime trades or some such plan, he's saved some money here. On the other hand, if he's been paying, say, $15 for each purchase of SPY, he's down another $1,890 (126 months * $15).
So what can I say?
First off, hookers and blow would've been more fun. Well, minus the physical risks and/or jail time — both of which, I suppose, would be considered as part of his "cost basis."
Second: The mainstream financial finger-waggers love to posit that dollar-cost averaging works because it allows you to "buy more shares at the lows." As we're seeing now, such "wisdom" is highly scenario-sensitive: It works great as long as those "generational lows" were late in someone else's generation, or really early in yours.
After all, our hero Diligent Investor was seen "buying more shares" at the "generational lows" of 2002 and 2003. That's worked out well, hasn't it?
Good thing that "new highs" are probably just a handful o' years away. Right?
I dunno. Let's ask Japan, whose main market index was trading around 10k in 1985 ... and is trading at ~9k now.
Third: I hope Diligent Investor's retirement horizon is well into the future. His current break-even sale price for his SPY investment is at $118.86 per share, which would require a rise of 40+ percent from current levels of roughly $84/share.
Somebody find another bubble. Quick.
Labels: Investing


