![]() Being a financial dork of the highest order, it should go without saying that I love spreadsheets. And I particularly enjoy the process of building good, useful ones.
Being a financial dork of the highest order, it should go without saying that I love spreadsheets. And I particularly enjoy the process of building good, useful ones.
Having been a spreadsheet aficionado for many years now, I thought it might be fun to scribble down a few of the “rules of thumb” for spreadsheet creation which I’ve learned over this time.
(Not only do I make free and for-pay financial spreadsheets for web surfers at large, but my Day Job involves lots of spreadsheet use, too. And many of these spreadsheets get distributed throughout the company, for use by everyone from fresh-faced newbies to blurry-eyed Excel veterans.)
That said, here are a few of my personal “Rules for Creating Spreadsheets That Don’t Suck.”
Tip #1: Spreadsheets For You ≠ Spreadsheets You Distribute
You might be able to get away with leaving cells unlocked (and the worksheet unprotected) in a spreadsheet you make for your own use, since you as Spreadsheet Creator presumably know what goes where. But that won’t fly with spreadsheets that you distribute for use by others.
There’s just no telling what someone else will type, nor where they’ll type it. Let’s face it: Stray key-punches are a fact of life. Get a homeless [SPACEBAR] entered into a vital, formula-holding cell, and an entire spreadsheet can detonate.
And that ain’t good.
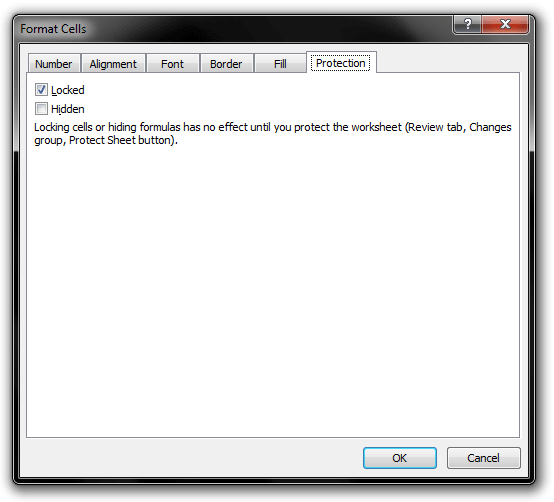
So be sure to unlock ONLY those cells where users are expected to enter data…

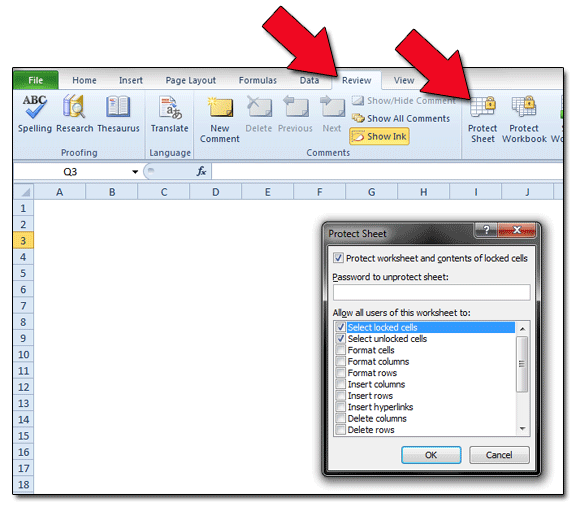
… and then PROTECT that worksheet!

Tip #2: Appearance freakin’ matters.
We’ve all seen them: Spreadsheets emailed to us by coworkers with NO idea of how to arrange and design data in a way that makes sense. Cell text overruns gridlines like snakes dumped on a chessboard; instructions are vague at best; you couldn’t make the page suitable for printing if you taped three sheets of legal paper end to end. What goes where? What’s that army of “#####” symbols in Column G supposed to signify? Should I enter new data in Cell R3, or not? Good luck figuring all this out without going thru every cell by hand … and taking notes.
Yeah. So, without any sort of cell formatting (read: background colors, borders, and so on) and coherent design to guide us, the actual usability of Coworker’s Latest Creation plummets so fast that it takes an act of God to keep this Excel disaster from being clicked ‘n’ dragged to a Recycle Bin demise.
In other words, appearance matters. A little cell formatting — often as simple as some understated background colors in those cells where data should be user-entered, with white for everything else — goes a long, long way. The latest versions of Excel provide a metric crap-load of tools to make your spreadsheets look decent. CELL → FORMAT is nothing to be afraid of, you know.
In other words, the best spreadsheets are a joy to look at, and work with. And the BEST best ones don’t look like spreadsheets at all.
Tip #3: Gridlines Are Bad. White space is good.
Plus, it’s easy on your printer. So use it liberally.
(This includes getting rid of gridlines, and instead manually creating cell borders when necessary. Unused oceans of gridlines are the devil.)
Tip #4: Color is most effective when used sparingly.
Remember what I said about using color above? Well, don’t go overboard with that. Personally, I like to color (and unlock!) only those cells where users will need to enter data. All other cells are left white. (And locked!)
Tip #5: Provide Detailed Labels and Notes…
Thinking a field is “self-explanatory” courts disaster. You pretty much have to get inside the user’s mind and consider this stuff; you ponder what they’ll be thinking and seeing and deciding. Any guidance you can give that helps get the user’s Datapoint A into the correct cell will pay off big.
Tip #6: …But Remember That Most People Don’t Read.
Nobody reads a darn thing anymore. I’m fairly confident that 99% of users start hammering numbers into most spreadsheets without throwing so much as a glance as the “Instructions & Notes” worksheets I almost always provide. But that’s the world we live in.
Build with the 99% in mind, but put some time into decent worksheet notes, too. Appreciate the 1%.
Tip #7: Gonna distribute? Use version numbers!
This is most applicable if you’re building spreadsheets for business use, where more than one person will be using the program. But it can also be helpful if you’re distributing your Excel creations on the internet.
By applying version numbers to your spreadsheets, you make it easier for users to know which iteration they’re working with. It also makes it a snap to determine if the spreadsheet version that Ron, your nosey coworker in Cubicle B3, is working on is newer and better than yours.
Tip #8: When possible, place column SUM formulas at the top of the data they tabulate.
This is kind of a little thing, but man, has it made my spreadsheeting life easier.
One of the great features of spreadsheets is their ability to analyze ever-changing amounts of data. However, when you build a spreadsheet to account for, say, a column with 100 rows of data which need to be totaled up, you might as well plan on that spreadsheet someday needing to total up 200 rows instead. So to make such a change easier, put your SUM formulas ABOVE the column’s uppermost data cell.
I know that for myself, it’s almost instinctive to want to total up columns (when that’s what is required) at the bottom of the current data. (Thanks, every math teacher I ever had!)
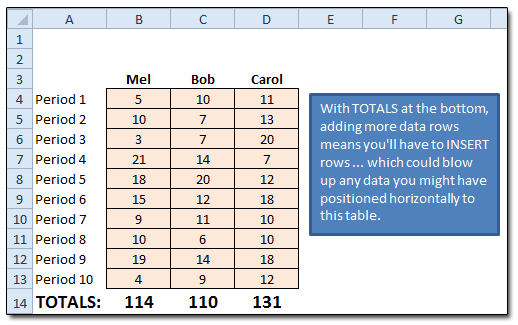
Here’s an example:

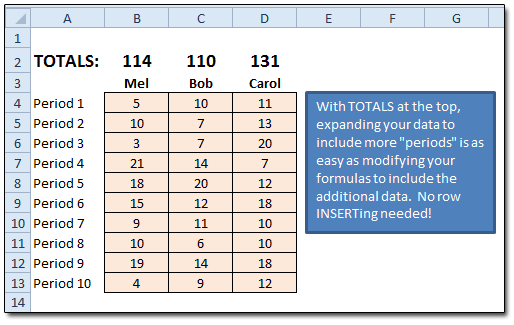
However, placing the TOTALS (or whatever formula you need) at the top of each column’s data makes it much easier to expand your data “downward” later:

With formulas at the column tops, you won’t have to go to the trouble of inserting rows (and possibly hosing your formulas) later on, when the need for more data becomes official … as it seemingly always does.


Dan wrote:
Love the tips, speaking from a fellow lover of all things excel! I might not agree with using the gridlines sparingly. But the last tip is brilliant. I might add that when necessary make the right adjustments to make the spreadsheet “print ready” so that no annoying partial pages end up getting printed.