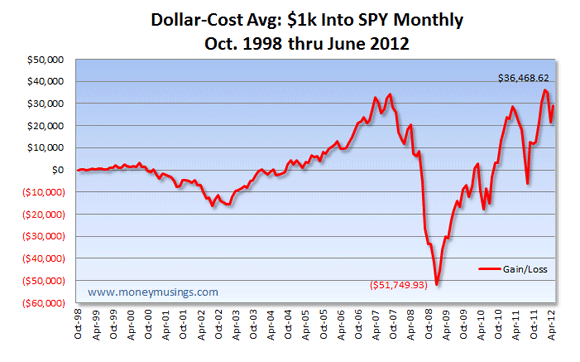
It recently occurred to me that I’d stopped tracking the performance of a hypothetical $1,000/month investment into the S&P 500 (via the SPY exchange-traded fund), going back to a start date of October, 1998. In fact, the last time I’d talked about this topic was my S&P 500 post of April, 2009. The market’s been on a great run since then, all things considered. (Thanks, Federal Reserve, for making sure asset prices don’t go down long-term!)
So here’s where our fictional dollar-cost-averaging investor would stand now (all dividends reinvested; returns exclude fees, taxes, etc.):

As of the end of June, 2012, our investor had a cost basis of $188,586. His investment would have been worth $217,672, for an on-paper gain of $29,085 over the course of those 13+ years. For those keeping score, he’s up a smidge over 15 percent, which equates to an internal rate of return of 2.16% per year.
Our investor’s high-profit mark, to date, was back in March of this year. Cashing out then would’ve brought a profit of $36,468. That mark looks to be eclipsed shortly, I’d think.
(From the “Wait, you mean there’s risk?” department, it’s worth noting that our investor was staring at a $5,833 loss as recently as September of 2011, too.)
Now all we need is for a Dave Ramsey acolyte to chime in with a “Look how your money grows when invested at 12 percent per year in good growth-stock mutual funds!” rant, and we’ll be on our way.
What Does This Tell Us?
I dunno. Go long antacid, maybe?


Parvinder@Readtoawake wrote:
Very interesting article on dollar cost averaging. It’s an amazing strategy to take advantage of stock market. Thanks for sharing.