1. CareerBuilder: 42% Live Paycheck to Paycheck

    This year’s CareerBuilder financial survey is out, and the headline ain’t really a shocker: 42 percent of workers report living paycheck-to-paycheck.

    CareerBuilder: 2011 Financial Survey

    And, of workers who make six figures, CareerBuilder found that 14 percent reported living paycheck to paycheck, and 6 percent reported that they were unable to make ends meet every month.

    CareerBuilder also asked the roughly 5,200 workers surveyed what they would or wouldn’t be willing to give up if push came to shove. Percentages of workers who “absolutely would not do without” certain items were as follows:

    • Internet Connection — 56 Percent
    • Driving — 46 Percent
    • Mobile Phone — 42 Percent
    • Cable TV — 27 Percent
    • Eating Out — 11 Percent

    A full 21 percent of workers reported either dipping into savings or reducing retirement contributions within the last year in order to get by.

    What Happened to Last Year’s Numbers?

    Last year, I noted that CareerBuilder’s survey found 7 in 10 workers living paycheck to paycheck. Curiously, this year’s survey says that last year’s survey found not the oh-my-gosh rate of 7 in 10, but rather 4.3 in 10. And I see that Press Release 784 (my source/link) has disappeared from CareerBuilder’s archives. I don’t know if their methodology has changed, or if they’re now running their numbers through the Federal Agency of Enforced Statistical Correctness before releasing them. Gotta wonder just what went on, though.





  2. Can You Come Up With $2k in a Hurry?

    Sure, the data is a couple of years old, but I don’t doubt it a bit:

    WSJ: Nearly Half of Americans ‘Financially Fragile’

    According to the study, roughly half of Americans reported that they “probably” or “definitely” could not come up with $2,000 if needed within 30 days.

    From the WSJ:

    The survey asked a simple question, “If you were to face a $2,000 unexpected expense in the next month, how would you get the funds you need?” In the U.S., 24.9% of respondents reported being certainly able, 25.1% probably able, 22.2% probably unable and 27.9% certainly unable.

    Other recent, similar surveys have told us that more than 3/4 of us live paycheck-to-paycheck, and 27 percent of us have no personal savings. So it’s not as if this WSJ article’s story is a surprise.


  3. Harris: 27% of Americans Have No Personal Savings

    If you’re a money-stats junkie like me, you live for figures like these from this recent Harris Poll:

    PR Newswire: More Americans Report No Personal or Retirement Savings

    Amazing, I know. Even though our economy just surged through a dotGov-sponsored Recovery Summer™, it seems that as of November, 2010, fewer of us reported having any personal or retirement savings.

    Here’s one of the survey’s more salient points to consider, if you’re a Gen Xer (as I am):

    Generationally, one-in-four (25%) Baby Boomers (aged 46-64) have no retirement savings, with 22% of Matures (aged 65 and over) stating the same. Gen Xers (aged 34-45) are struggling with more immediate issues; 32% have no personal savings.

    When one in three 34-to-45-year-olds reports having no personal savings, then you know our consume-it-all economic setup is working precisely as designed. And as one of the accompanying tables shows, the same percentage of Gen Xers report having no retirement savings.

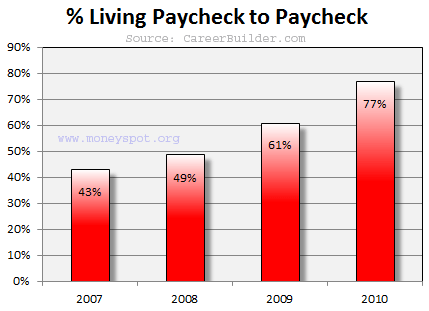
    Couple this sort of data with that from other late-2010 surveys — CareerBuilder, for instance, found that 77 percent of us survive paycheck-to-paycheck, even $100k earners — and the picture that emerges is downright scary.


  4. Where Does Your Income Rank?

    Interested in knowing how your income stacks up against that of your neighbors? Check out the following Slate.com article:

    Slate: Why We Can’t Ignore Income Inequality

    Once there, scroll down about one-third of the way through the page. You’ll see a text-box tool labeled “Where Do I Stand?”; that’s what you’re looking for.

    Enter your ZIP code and your income in the boxes provided, and you’ll get to find out just how your income ranks against that of your neighbors, as well as against your state’s median income.

    FWIW, according to this tool, my income is almost double the average income of my particular ZIP code. I’m not surprised, as Lisa and I still live in the first home we ever bought. In that regard, at least, I think that “living below your means” really shows up in data like this. No chasing the Joneses in our household!

    NOTE: There’s also some pretty neat data to be found at the IncomeTaxList site, from which some of the Slate tool’s findings are derived.


  5. Food Stamp Participation: Still Rising

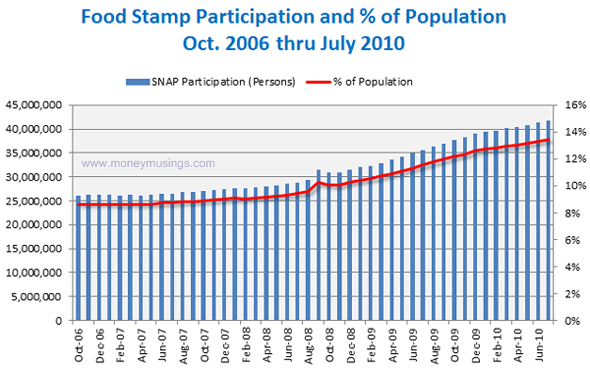
    Here’s a shocker: U.S. food-stamp participation (now called the Supplemental Nutrition Assistance Program, or SNAP) is still rising.

    Per Bloomberg, roughly one in eight Americans will participate in the program during the upcoming fiscal year.

    Chart source data here and here. Ugly spreadsheet here.


  6. CareerBuilder: 77% Living Paycheck to Paycheck

    Now this is some encouraging news … if you enjoy financial distress.

    If we’re to believe CareerBuilder’s survey of 4,500 U.S. workers — and I don’t really have a great reason not to — then roughly 77 percent of us describe ourselves as living paycheck to paycheck:

    CareerBuilder: Nearly 8 in 10 Living Paycheck to Paycheck

    From the article:

    Nearly eight-in-ten (77 percent) workers report that they live paycheck to paycheck to make ends meet. Sixty-one percent of workers said that they felt they lived paycheck to paycheck to make ends meet in 2009. Workers went on to say that sometimes they are unable to make ends meet at all, with one-in-five (22 percent) saying they have missed payments on bills in the last year.

    Ouch. Earlier this year, I mentioned that more and more $100k workers were living paycheck to paycheck, too.

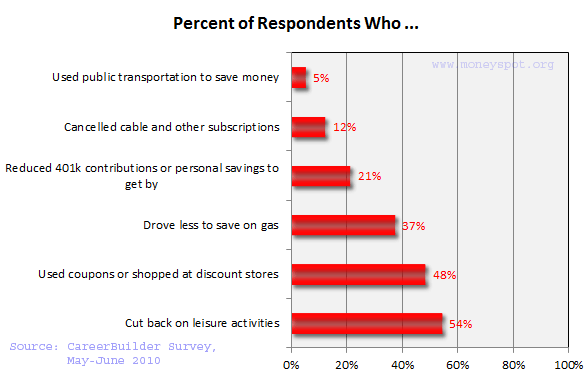
    For those of you who like charts, here’s one with a bit more data from the CareerBuilder survey:

    Pretty great, ain’t it, that more people were willing to dip into savings and retirement accounts than were willing to cancel their cable TV and other subscriptions. What the hell are people thinking?

    And since I’ve already got Excel open, I might as well update this running chart while I’m at it:

    If you’re interested in comparisons, I covered last year’s CareerBuilder survey here.


  7. Survey: Americans Want Mortgage Subsidies

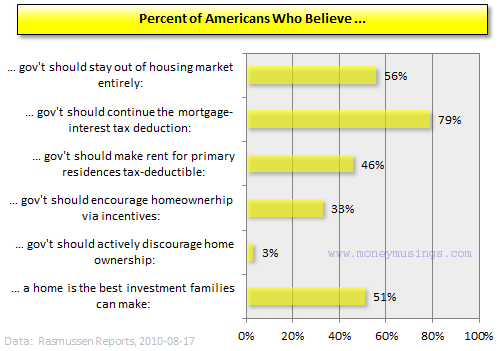
    Fun new survey data out from Rasmussen, regarding Americans and how they currently feel about government participation in the mortgage market:

    Rasmussen: Mortgage Survey

    See the glaring disconnect in the first two items? If fifty-six percent of Americans think the government should stay “altogether” out of the mortgage market, but seventy-nine percent want the mortgage-interest deduction to continue, then an awful lot of people have an awfully shallow view of what “government participation” means.

    If you don’t think that the mortgage-interest deduction amounts to a subsidy for homeowners, and therefore, is the very essence of “government participation” in the market, then you’re nuts. Take away that deduction, and see what happens to home prices. Mortgage qualification standards are based upon that federal tax deduction being there, effectively “helping” people make their house payments. If the deduction were to go away, qualification standards would necessarily tighten. Joe and Jane Sixpack wouldn’t be able to qualify for as high a mortgage payment as they could previously, as more of their gross income would now be going to taxes. Thus, over time, home prices would decline.

    For this survey to mean much, someone really ought to define “altogether.” Because to me, that’d mean the dissolution of Fannie, Freddie, and the FHA, as well as the removal of the mortgage-interest tax deduction. But that wasn’t what the Rasmussen respondents inferred, or were told. Obviously.

    What an idea, huh? Get rid of Fannie, Freddie, the FHA — who between them control 90 percent of the mortgage market these days — and the sacrosanct mortgage-interest deduction. You want to talk about a full-on house price collapse? That’d do it!


  8. FedReserve: Credit Conditions Reports

    The stats junkies out there will undoubtedly want to take a look at this new website, courtesy of the Federal Reserve:

    New York Fed: U.S. Credit Conditions and Quarterly Report

    Look for the New York Fed to update its nifty Report on Household Debt and Credit every quarter. As of this writing, the first (and latest) report is for 2010 Quarter 2.

    Lots of charts there (viewable as JPEG or PDF) for the economics dorks among us!


  9. Home (Free) on the Range

    You want stimulus? Well, how ’bout the chance to go almost 15 months without a house payment?
    Thanks to cottony-soft (and FedGov encouraged) accounting standards, banks are loathe to foreclose on underwater properties. As a bank, realizing five- and six-digit losses is no fun. It tends to leave ouchies on your balance sheet, and more importantly, has a negative effect on management bonuses.

    Cause, meet effect:

    Defaulted borrowers were spending an average of 469 days in their home after ceasing to make payments as of July 31, so the financial attraction of strategic defaults increases.

    Four hundred days with no house payment? A fellow could save up quite a stash in his piggy bank, going that long without sending a check to the mortgage company.

    In any case, that tantalizing little snippet comes from an article at AmericanBanker.com.

    And speaking of homeowner savings, just imagine all the dutiful home care and maintenance being performed by all these “living free for now” borrowers — borrowers who know that one day the bank will be coming to throw their La-Z-Boy on the lawn and Master Lock all the doors. The question isn’t if, but when.

    Oh, I’m sure that leaky roof will get fixed. Any day now.

    Yes, indeed. Delaying foreclosures (most econ-types refer to it as “extend and pretend”) with schemes like relaxed accounting standards and FedGov-initiated can-kickings (HAMP much?) should work out just fine.


  10. DTIs of HAMP Modification Recipients

    Because I have become very much a financial hardass in my old age, I’ve been against FedGov’s HAMP program from Day One. (To show that I am an Equal Opportunity Hardass, I am virulently against taxpayer funds going to banks or other corporate entities, as well.)

    Still, I keep up with HAMP results (or lack thereof) because train wrecks this large are just hard to ignore. And also because watching FedGov throw piles of good money after bad is better entertainment than most primetime TV (which isn’t saying much).

    So here we go with the July batch of HAMP results:

    Financialstability.gov: HAMP Servicer Report — July 2010

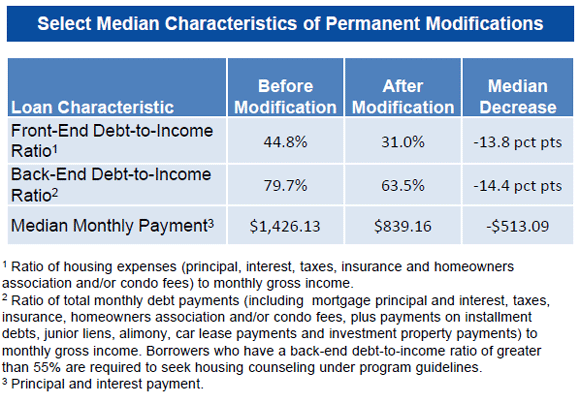
    In particular, I’d like to call reader attention to a chart on page three:

    Aside from the inherent irony in finding numbers like this at a site called “financialstability.gov,” and ignoring the brazen injustice done by allowing any U.S. dot-gov entity to even use said domain, you have to be amazed — really amazed — at the financial condition of HAMPsters at large.

    With Numbers This Bad…

    What we see here is that for folks who’ve had their mortgages modified via HAMP, the median debt-to-income (DTI) ratios are downright scary.

    Think about this: The median back-end DTI for successful HAMP applicants, before their mortgages were modified, was almost 80 percent.

    After mod, the median back-end DTI is still almost 64 percent.

    So, at the median, having 64 percent of their pre-tax income going to debt payments is an improvement.

    And since part of HAMP qualification is supposed to focus on whether or not the borrower actually has a shot at staying in the house, presumably making payments to the bank from now until pigs fly, then you have to wonder just how bad the non-approved applicants’ DTIs are. (Almost half of the people who’ve applied to HAMP have been bounced from the program, for various reasons.)

    If having a 60+ percent back-end DTI after a modification is seen as “affordable,” then I probably don’t want to what “unaffordable” is.

    Yeah. Mortgage modifications or not, these are still defaults looking for a place to happen.

    Get Ya Some

    I’d step up to the trough and request a modification for myself — hey, who doesn’t want a “more affordable” mortgage PLUS the opportunity to stick somebody else with the bill? — but somehow I doubt that my front- and back-end DTIs of roughly ten percent would allow me to qualify for any sweet HAMP action. (Since I have no non-mortgage debt, both of my DTIs are equal.)

    Darn the bad luck, anyway. Savers and responsible folk? Shut out from reaping taxpayer largesse once again.

    Instead, we just get to pay for it.