Each year, once I’ve completed and filed our income taxes, I like to spend a little time calculating my household’s effective tax rate. What’s an “effective tax rate,” you ask?
Well, it’s a way for me to get outside of the usual “What tax bracket are you in?” thinking that so many folks seem mired in. Yes, income-tax brackets get all the media focus and hubbub, especially when tax rates change, but last time I checked, I pay more taxes than just the “income” variety.
Since income taxes are really only part of our overall, real-world tax picture — think Medicare taxes, Social Security taxes, property taxes, and so on — it strikes me that figuring a more comprehensive “effective tax rate” gives a much better feel for how much of our money is really going out the door to the Tax Man.
What’s Included in ETR?
When I calculate my effective tax rate (“ETR,” for short), I start by figuring out my household’s gross annual income. That includes total wages and salaries (Form W-2, Box 3), interest earnings, non-retirement-account investment income, and any other sideline income that existed for that tax year. Added together, all those items get me the “Gross Income” figure for my formula below.
On the taxes-paid side of things, I tally up our federal income taxes paid (Form 1040, Line 60), minus any credits below that line — the last two years’ “Making Work Pay” credits would qualify here. Added to that are state income taxes paid (if any), Social Security taxes, Medicare taxes, and any property or local taxes that I forked over during the year. If I have any excise or other taxes that I paid during the year, I lob those in here, too.
Since I do separate some of my utility-bill taxes in Quicken, those figures go here, as well.
What About Sales Taxes?
Yes, to get a true tax picture, the year’s cumulative sales taxes also should get figured in.
However, tracking sales taxes in Quicken with any sort of precision would mean that most every transaction becomes a split. Whilst I love me some in-depth financial data, I’m just not gung-ho enough to go that far. You gotta draw the line somewhere, right?
(My annual use taxes do get figured in, though, because they’re included in the amount shown on the tax-form line I use for my Oklahoma “state taxes paid” above.)
Initially, I planned to omit sales taxes altogether. But as I wrote this, it occurred to me that I could simply fire up an annual cash-flow report in Quicken, export it to Excel, and remove all categories that either (1) aren’t sales-taxable, or (2) already had use tax paid applied. I could take the remaining categories and do a little math on them.
So I did. Figuring a rough estimate of total sales-taxes paid wasn’t too hard, with exception of auto fuel and its “cents-per-gallon, plus X percent sales tax” setup. Everything else? Pretty simple.
For instance, our sales-tax rate on groceries was 8.25 percent, and we spent $5,332 on groceries last year, taxes and all. We can estimate that $406 of this was due to sales tax. [5332 − (5332 / 1.0825) = 406]
Once I dumped that Quicken report into Excel, and autofilled the correct formulas, the sales-tax math was a breeze.
(Yeah, over time, changes in sales-tax rates will complicate this. But again, all I’m looking for is a rough estimate!)
A Tax Rate That’s “Effective”
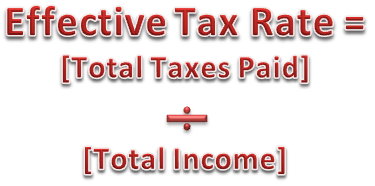
Once all those items are tallied up, the rest is easy:

And that’s all. Take your [Total Taxes Paid] amount, and divide it by your [Total Gross Income] amount. The rate that results is your Effective Tax Rate.
Now, I’ve been calculating my effective tax rate for years, though prior to 2010 I focused only on income taxes. Because I’m a dork who finds such comparisons fun, I tried to standardize things a bit this year so that I could go backwards through our tax returns and see how our ETR — now expanded to include all the other taxes we pay — has changed over time.

So, for tax year 2010, roughly 21.9 percent of our income went toward taxes of one kind or another. For 2009, our effective tax rate was 21.5 percent. And back in 2008? A bit higher, at 23.9 percent.
Summary
For a while now, I’ve really preferred to think of my tax burden in terms of this overall “effective tax rate,” rather than in terms of federal and state tax-bracket rates … which is what so many people do. Income taxes are only part of the picture, after all. Until you look at your tax burden in total, taking into account all the directions from which the Tax Man gets into your wallet, then it’s pretty easy to miss the immense impact that taxes have on your total financial picture.
As the figures above show, I might be in the 15 percent federal tax bracket … but that sure doesn’t mean I’m handing a mere 15 percent of my income to the tax authorities!


